DP-203: Data Engineering on Microsoft Azure
A company has a real-time data analysis solution that is hosted on Microsoft Azure. The solution uses Azure Event Hub to ingest data and an Azure Stream Analytics cloud job to analyze the data. The cloud job is configured to use 120 Streaming Units (SU).
You need to optimize performance for the Azure Stream Analytics job.
Which two actions should you perform?
Implement event ordering
Scale the SU count for the job up
Implement Azure Stream Analytics user-defined functions (UDF)
Scale the SU count for the job down
Implement query parallelization by partitioning the data output
Implement query parallelization by partitioning the data input
Answer are; Scale the SU count for the job up
Implement query parallelization by partitioning the data input
Scale out the query by allowing the system to process each input partition separately.
A Stream Analytics job definition includes inputs, a query, and output. Inputs are where the job reads the data stream from.
References:h
https://docs.microsoft.com/en-us/azure/stream-analytics/stream-analytics-parallelization
You use Azure Stream Analytics to receive Twitter data from Azure Event Hubs and to output the data to an Azure Blob storage account.
You need to output the count of tweets during the last five minutes every five minutes.
Which windowing function should you use?
a five-minute Sliding window
a five-minute Session window
a five-minute Tumbling window
has a one-minute hop
Answer is a five-minute Tumbling window
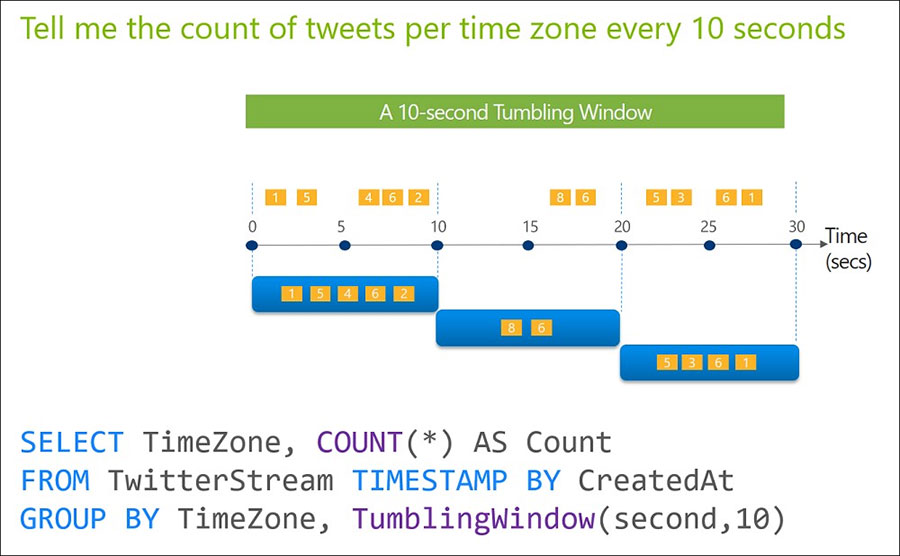
Tumbling window functions are used to segment a data stream into distinct time segments and perform a function against them, such as the example below. The key differentiators of a Tumbling window are that they repeat, do not overlap, and an event cannot belong to more than one tumbling window.
SELECT
   Timezone,
   Count(*) AS  Count
FROM TwitterStream
TIMESTAMP BY CreatedAt
GROUP BY
   TimeZone,
TumblingWindow(second,10)
Incorrect Answers:
Hopping window functions hop forward in time by a fixed period. It may be easy to think of them as Tumbling windows that can overlap, so events can belong to more than one Hopping window result set. To make a Hopping window the same as a Tumbling window, specify the hop size to be the same as the window size.
Reference:
https://docs.microsoft.com/en-us/azure/stream-analytics/stream-analytics-window-functions
You need to implement complex stateful business logic within an Azure Stream Analytics service.
Which type of function should you create in the Stream Analytics topology?
JavaScript user-define functions (UDFs)
Azure Machine Learning
JavaScript user-defined aggregates (UDA)
Answer is JavaScript user-defined aggregates (UDA)
Azure Stream Analytics supports user-defined aggregates (UDA) written in JavaScript, it enables you to implement complex stateful business logic. Within UDA you have full control of the state data structure, state accumulation, state decumulation, and aggregate result computation.
References:
https://docs.microsoft.com/en-us/azure/stream-analytics/stream-analytics-javascript-user-defined-aggregates
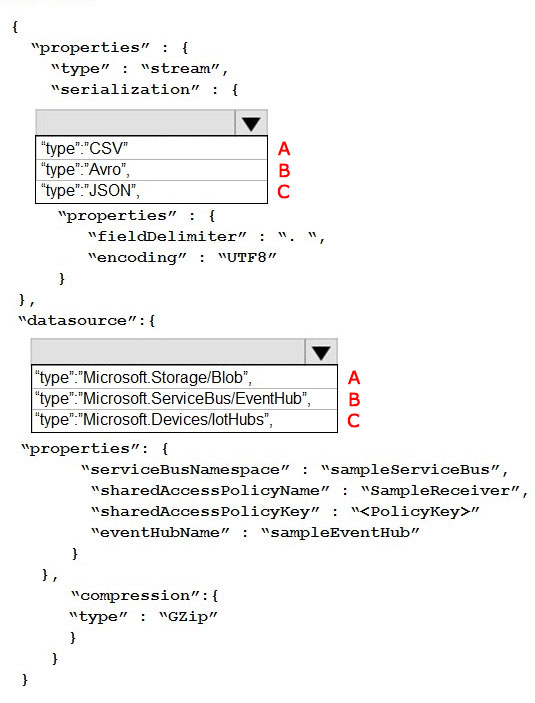
A company plans to analyze a continuous flow of data from a social media platform by using Microsoft Azure Stream Analytics. The incoming data is formatted as one record per row. You need to create the input stream. How should you complete the REST API segment?
A - A
A - B
A - C
B - C
B - A
C - B
C - A
C - C
Answer is A - B
Box 1: CSV
A comma-separated values (CSV) file is a delimited text file that uses a comma to separate values. A CSV file stores tabular data (numbers and text) in plain text.
Each line of the file is a data record.
JSON and AVRO are not formatted as one record per row.
Box 2: "type":"Microsoft.ServiceBus/EventHub",
Properties include "EventHubName"
References:
https://docs.microsoft.com/en-us/azure/stream-analytics/stream-analytics-define-inputs
https://en.wikipedia.org/wiki/Comma-separated_values
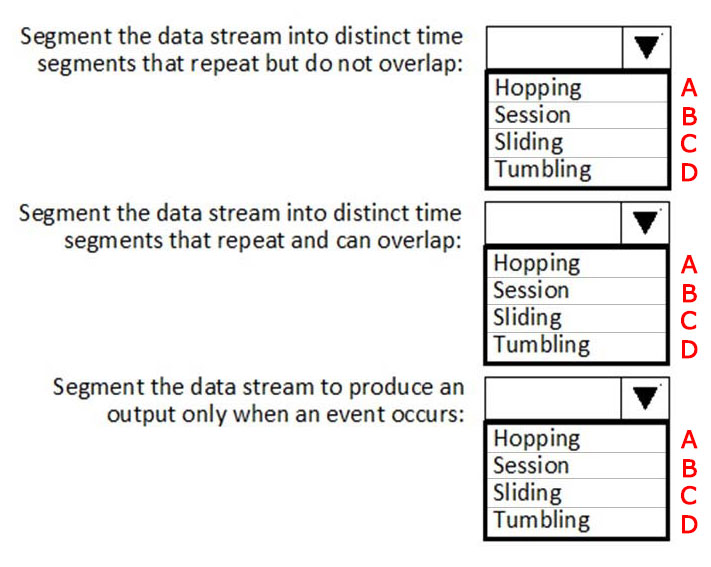
You are implementing Azure Stream Analytics functions.
Which windowing function should you use for each requirement?
A-B-C
B-A-A
C-D-B
D-A-C
A-C-D
B-C-D
C-D-A
D-A-B
Answer is D-A-C
Box 1: Tumbling
Tumbling window functions are used to segment a data stream into distinct time segments and perform a function against them, such as the example below. The key differentiators of a Tumbling window are that they repeat, do not overlap, and an event cannot belong to more than one tumbling window.
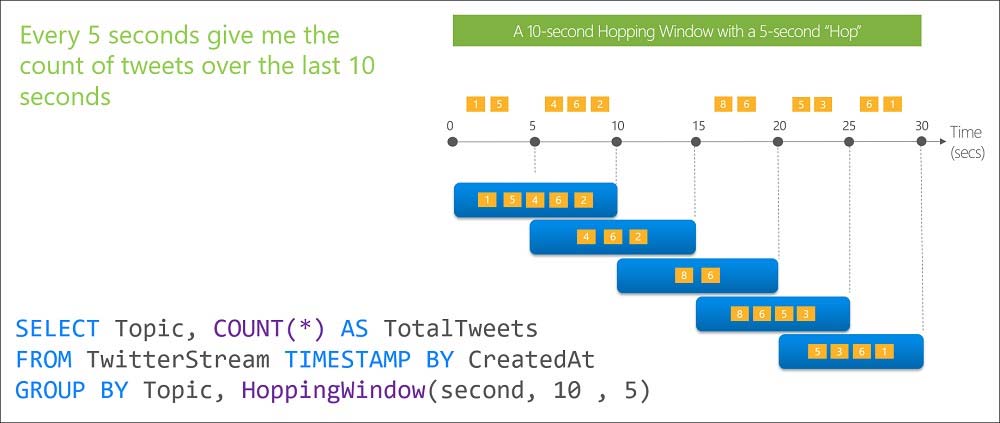
Box 2: Hoppping
Hopping window functions hop forward in time by a fixed period. It may be easy to think of them as Tumbling windows that can overlap, so events can belong to more than one Hopping window result set. To make a Hopping window the same as a Tumbling window, specify the hop size to be the same as the window size.
Box 3: Sliding
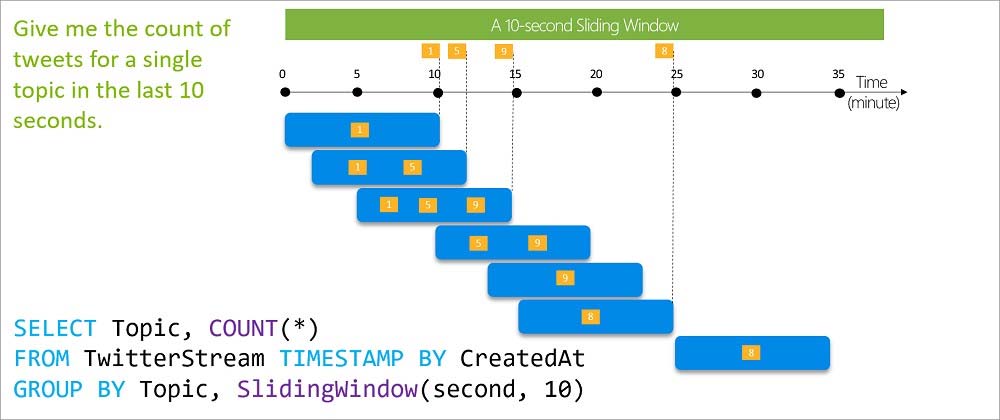
Sliding window functions, unlike Tumbling or Hopping windows, produce an output only when an event occurs. Every window will have at least one event and the window continuously moves forward by an € (epsilon). Like hopping windows, events can belong to more than one sliding window.
References:
https://docs.microsoft.com/en-us/azure/stream-analytics/stream-analytics-window-functions
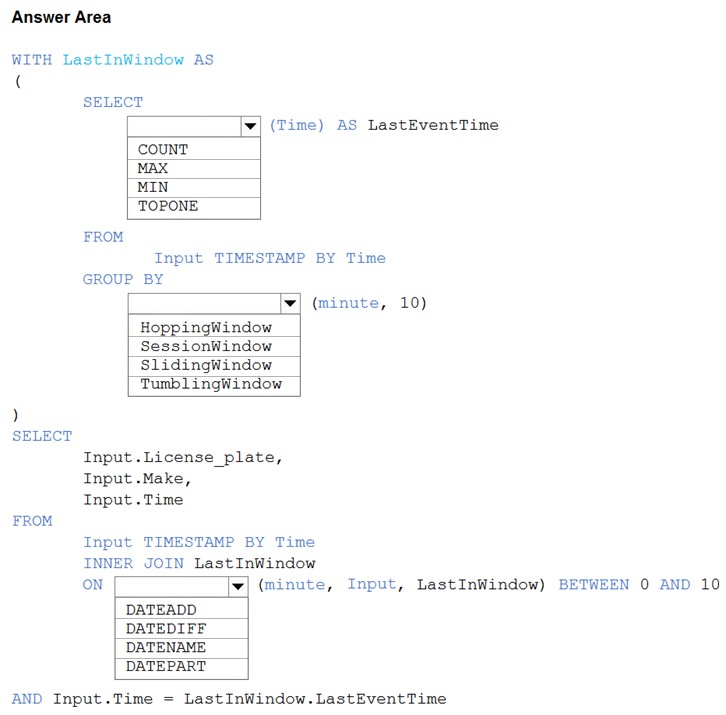
You are processing streaming data from vehicles that pass through a toll booth.
You need to use Azure Stream Analytics to return the license plate, vehicle make, and hour the last vehicle passed during each 10-minute window.
How should you complete the query?
Check the answer section
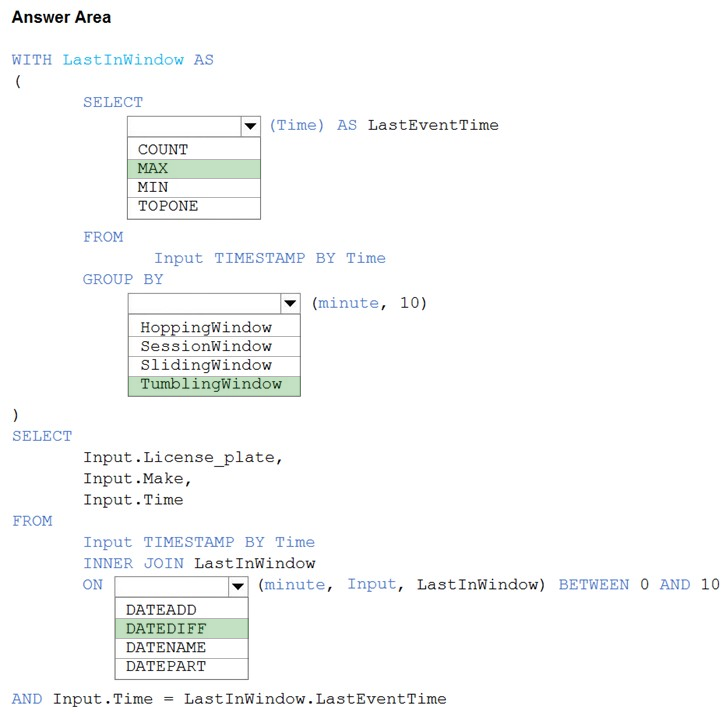
WITH LastInWindow AS
(
   SELECT
      MAX(Time) AS LastEventTime
   FROM
      Input TIMESTAMP BY Time
   GROUP BY
      TumblingWindow(minute, 10)
)
SELECT
   Input.License_plate,
   Input.Make,
   Input.Time
FROM
   Input TIMESTAMP BY Time
INNER JOIN LastInWindow
   ON     DATEDIFF(minute, Input, LastInWindow) BETWEEN 0 AND 10
      AND Input.Time = LastInWindow.LastEventTime
Box 2: TumblingWindow
Tumbling windows are a series of fixed-sized, non-overlapping and contiguous time intervals.
Box 3: DATEDIFF
DATEDIFF is a date-specific function that compares and returns the time difference between two DateTime fields, for more information, refer to date functions.
Reference:
https://docs.microsoft.com/en-us/stream-analytics-query/tumbling-window-azure-stream-analytics
You have an Azure Stream Analytics job that is a Stream Analytics project solution in Microsoft Visual Studio. The job accepts data generated by IoT devices in the JSON format.
You need to modify the job to accept data generated by the IoT devices in the Protobuf format.
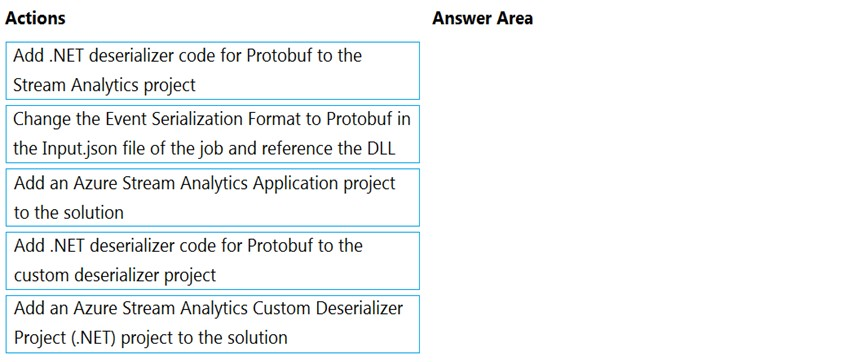
Which three actions should you perform from Visual Studio in sequence?
Check the answer section
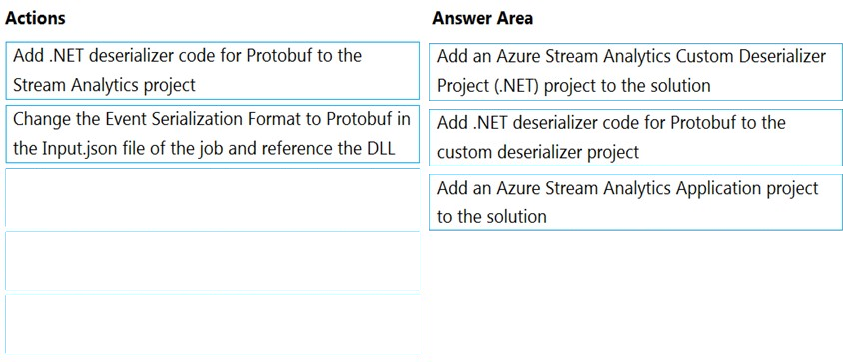
Step 1: Add an Azure Stream Analytics Custom Deserializer Project (.NET) project to the solution.
Create a custom deserializer
1. Open Visual Studio and select File > New > Project. Search for Stream Analytics and select Azure Stream Analytics Custom Deserializer Project (.NET). Give the project a name, like Protobuf Deserializer.
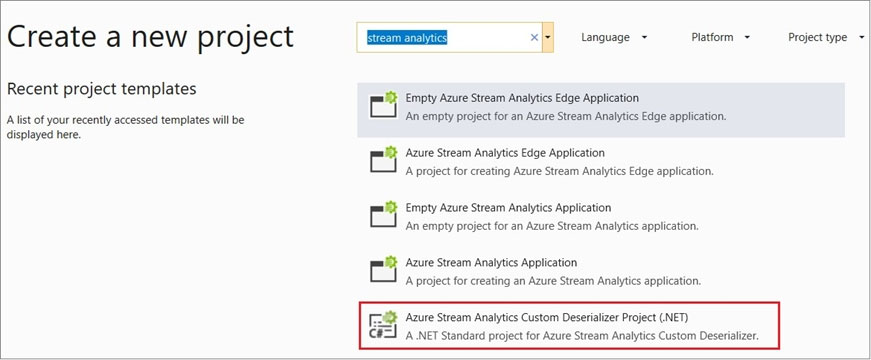
2. In Solution Explorer, right-click your Protobuf Deserializer project and select Manage NuGet Packages from the menu. Then install the Microsoft.Azure.StreamAnalytics and Google.Protobuf NuGet packages.
3. Add the MessageBodyProto class and the MessageBodyDeserializer class to your project.
4. Build the Protobuf Deserializer project.
Step 2: Add .NET deserializer code for Protobuf to the custom deserializer project
Azure Stream Analytics has built-in support for three data formats: JSON, CSV, and Avro. With custom .NET deserializers, you can read data from other formats such as Protocol Buffer, Bond and other user defined formats for both cloud and edge jobs.
Step 3: Add an Azure Stream Analytics Application project to the solution
Add an Azure Stream Analytics project
1. In Solution Explorer, right-click the Protobuf Deserializer solution and select Add > New Project. Under Azure Stream Analytics > Stream Analytics, choose
Azure Stream Analytics Application. Name it ProtobufCloudDeserializer and select OK.
2. Right-click References under the ProtobufCloudDeserializer Azure Stream Analytics project. Under Projects, add Protobuf Deserializer. It should be automatically populated for you.
Reference:
https://docs.microsoft.com/en-us/azure/stream-analytics/custom-deserializer
You are building an Azure Stream Analytics query that will receive input data from Azure IoT Hub and write the results to Azure Blob storage.
You need to calculate the difference in readings per sensor per hour.
How should you complete the query?

Check the answer section

Box 1: LAG
The LAG analytic operator allows one to look up a previous event in an event stream, within certain constraints. It is very useful for computing the rate of growth of a variable, detecting when a variable crosses a threshold, or when a condition starts or stops being true.
Box 2: LIMIT DURATION
Example: Compute the rate of growth, per sensor:
SELECT sensorId,
   growth = reading
   LAG(reading) OVER (PARTITION BY sensorId LIMIT DURATION(hour, 1))
FROM input
Reference:
https://docs.microsoft.com/en-us/stream-analytics-query/lag-azure-stream-analytics
You are building an Azure Stream Analytics job to identify how much time a user spends interacting with a feature on a webpage.
The job receives events based on user actions on the webpage. Each row of data represents an event. Each event has a type of either 'start' or 'end'.
You need to calculate the duration between start and end events.
How should you complete the query?
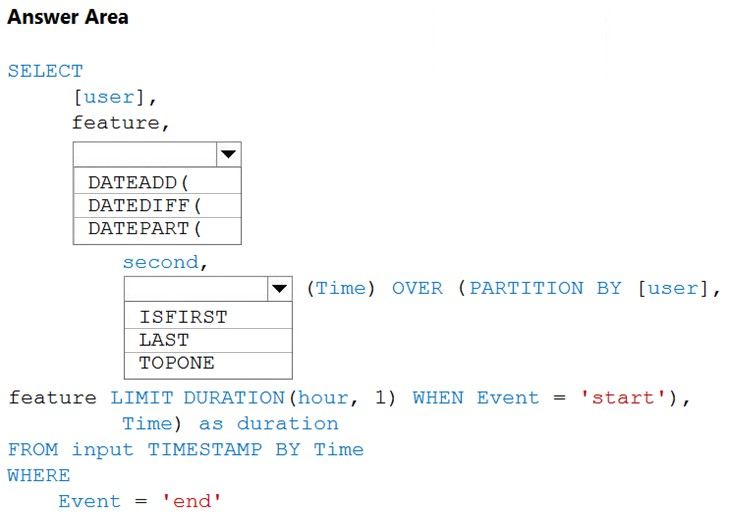
Check the answer section
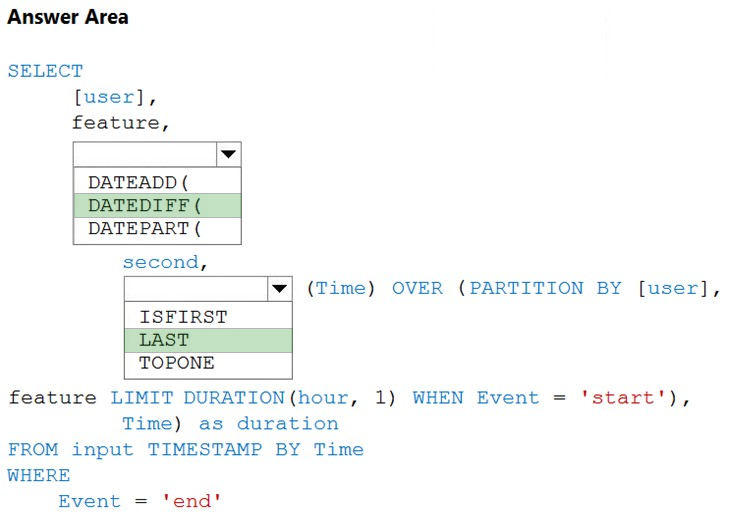
Box 1: DATEDIFF
DATEDIFF function returns the count (as a signed integer value) of the specified datepart boundaries crossed between the specified startdate and enddate.
Syntax: DATEDIFF ( datepart , startdate, enddate )
Box 2: LAST
The LAST function can be used to retrieve the last event within a specific condition. In this example, the condition is an event of type Start, partitioning the search by PARTITION BY user and feature. This way, every user and feature is treated independently when searching for the Start event. LIMIT DURATION limits the search back in time to 1 hour between the End and Start events.
Example:
SELECT [user], feature, DATEDIFF( second, LAST(Time) OVER (PARTITION BY [user], feature LIMIT DURATION(hour, 1) WHEN Event = 'start'), Time) as duration FROM input TIMESTAMP BY Time WHERE Event = 'end'
Reference:
https://docs.microsoft.com/en-us/azure/stream-analytics/stream-analytics-stream-analytics-query-patterns
You have an Azure Stream Analytics job named ASA1.
The Diagnostic settings for ASA1 are configured to write errors to Log Analytics.
ASA1 reports an error, and the following message is sent to Log Analytics.
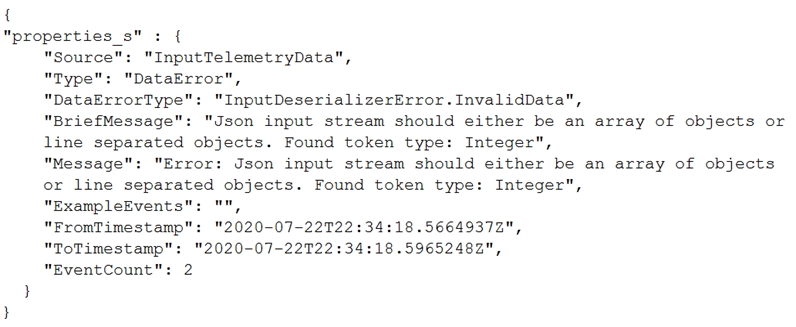
You need to write a Kusto query language query to identify all instances of the error and return the message field.
How should you complete the query?
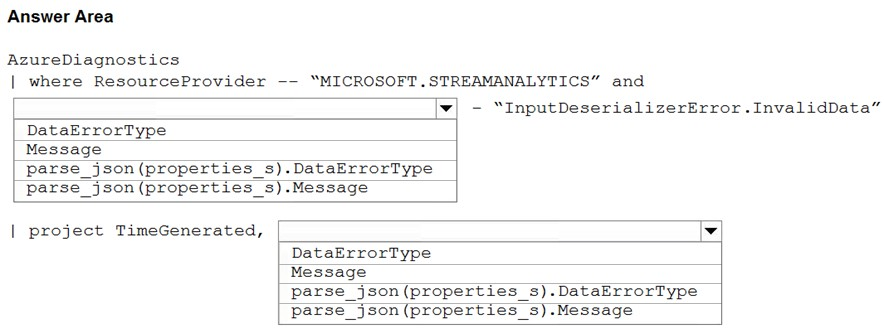
Check the answer section
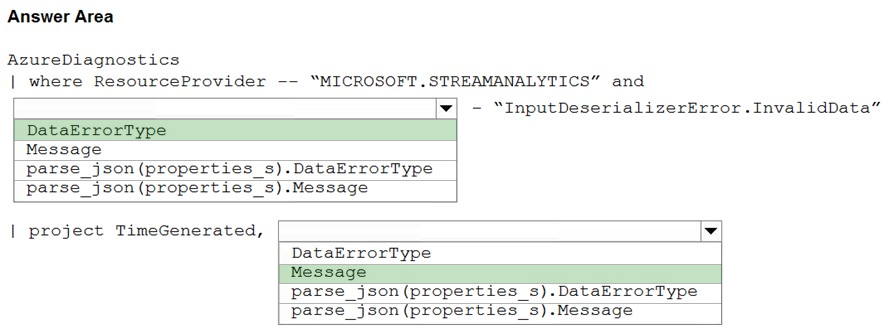
Box 1: DataErrorType
The DataErrorType is InputDeserializerError.InvalidData.
Box 2: Message
Retrieve the message.
Reference:
https://docs.microsoft.com/en-us/azure/stream-analytics/data-errors