PL-300: Microsoft Power BI Data Analyst
Question 81
If you import or create your own date table, which of these requirements must it meet?
Must contain all the days for all years represented in the model
Cannot contain duplicate dates
Must have at least one field set as a Date or DateTime datatype
All of the above
Answer is All of the above
To import or create your own date table, it must meet all 3 of these requirements, and all times must be identical (i.e. 12:00).
You have a Microsoft Excel 2016 workbook that has a Power Pivot model. The model contains the following tables:
- Product (Product_id, Product_Name)
- Sales (Order_id, Order_Date, Product_id, Salesperson_id, Sales_Amount)
- Salesperson (Salesperson_id, Salesperson_name, address)
The model has the following relationships:
- Sales to Product
- Sales to Salesperson
You create a new Power BI file and import the Power Pivot model.
You need to ensure that you can generate a report that displays the count of products sold by each salesperson.
What should you do before you create the report?
Create a one-to-one relationship between Product and Salesperson.
For each relationship, change the Cross filter direction to Both.
For each relationship, change the Cardinality to One to one (1:1).
Change a many-to-one relationship between Product and Salesperson.
Answer is For each relationship, change the Cross filter direction to Both.
Their's no need to create another relationship, the model already has one that extends to the needed level. You know only need to allow the Sales table to filter Product an you can do that by changing the cross filter to both.
References:
https://docs.microsoft.com/en-us/power-bi/desktop-create-and-manage-relationships
You have two tables named CustomerVisits and Date in a Power BI model.
You create a measure to calculate the number of customer visits. You use the measure in the report shown in the exhibit.

You discover that the total number of customer visits was 60,000, and that there were only 5,000 customer visits in August.
You need to fix the report to display the correct data for each month.
What should you do?
Modify the measure to use the CALCULATE DAX function.
Create a relationship between the CustomerVisits table and the Date table.
Modify the measure to use the sum DAX function.
Create a hierarchy in the Date table.
Answer is Create a relationship between the CustomerVisits table and the Date table.
References:
https://docs.microsoft.com/en-us/power-bi/desktop-create-and-manage-relationships
https://docs.microsoft.com/en-us/power-bi/desktop-tutorial-create-measures
You have a query that retrieves sales data. A sample of the data is shown in the following table.
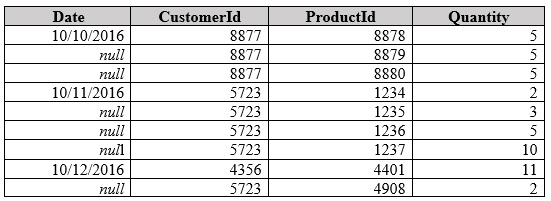
You need to ensure that the values in the Date column contain a date. Null values must be replaced with the date from the previous row.
What should you click on the Transform tab in Query Editor?
Format, and then Clean
Date, and then Earliest
Fill, and then Down
Replace Values, and then Replace Errors
Answer is Fill, and then Down
Under Fill in the Transform ribbon, you DOWN (for replacing null values with preceding values, and UP (replaces null values with values after them).
References:
https://www.excelcampus.com/library/fill-down-blank-null-cells-power-query/
You have a table named Sales. A sample of the data in Sales is shown in the following table.
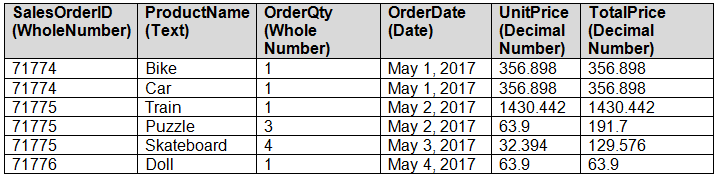
You create a stacked column chart visualization that displays ProductName by Date.
You discover that the axis for the visualization displays all the individual dates.
You need to ensure that the visualization displays ProductName by year and that you can drill down to see ProductName by week and day.
What should you do first?
Create a new table that has columns for the date, year, week, and day.
Create a new hierarchy in the Sales table.
Format the visualization and set the type of the X-Axis to Categorical.
Configure a visual filter for the Date column that uses an advanced filter.
Answer is Create a new table that has columns for the date, year, week, and day.
1. create a Date table, including columns: date, week, month, quarter, year.
2. and then create relationship between table "date" and fact table "Sales via [Date].
3. hierarchy: Y/M/W/D
You have a Power BI data model that contains a Sale Date table.
You need to add a second date table named Ship Date that contains the same columns as those in Sale Date. The solution must NOT repeat the query logic.
What should you do to create the query for Ship Date?
Reference the Sale Date query.
Duplicate the Sale Date query.
Rename the Sale Date query to Ship Date.
Append the Sale Date query as a new query.
You need to create a relationship between two tables named Sales and Sales Detail in a Power BI data model. For every row in the Sales table, there is at least one row, and possibly multiple rows, in the Sales Detail table.
How should you configure the relationship?
one-to-one from Sales to Sales Detail
one-to-many from Sales to Sales Detail
many-to-many from Sales to Sales Detail
many-to-one from Sales to Sales Detail
You preview a single table in the Power Query Editor in Power BI Desktop. The table contains the following columns: LocationName, LocationID, Temperature, and DateTime.
You need to convert the table into a properly formed star schema.
To which table should you add the LocationName field?
Select only one answer.
Date Dimension
Location Dimension
Location Fact
Temperature Measurements Fact
Answer is Location Dimension
You have a Microsoft Power BI semantic model that contains two tables named DimDate and FactSales. DimDate is the main date table in the model. FactSales is a fact table that contains data about sales orders.
FactSales has the following three relationships to DimDate:
• An active relationship between FactSales[OrderDate] and DimDate[Date]
• An inactive relationship between FactSales[ShipDate] and DimDate[Date]
• An inactive relationship between FactSales[ReturnDate] and DimDate[Date]
Which type of dimension is DimDate?
degenerate dimension
junk dimension
outrigger dimension
role-playing dimension
Answer is role-playing dimension
You have a Microsoft Power BI semantic model that contains a dimension table named DimCustomer and a fact table named FactOrder. DimCustomer contains one row per customer. FactOrder contains one row per order.
You need to create a relationship between DimCustomer and FactOrder.
Which type of relationship cardinality should you choose?
many-to-many
many-to-one
one-to-many
one-to-one
Answer is one-to-many