PL-300: Microsoft Power BI Data Analyst
Question 91
You have a Microsoft Power BI semantic model that contains three tables named FactSales, DimProduct, and DimDate. There is a relationship between FactSales and DimProduct and FactSales and DimDate. The model is used to create reports that show monthly sales by product.
FactSales contains 50 million rows of daily sales data. DimProduct contains 1,000 rows, with each row representing a unique product. DimDate contains sales dates for the last three years.
You need to minimize the size of the semantic model. The solution must support the reporting requirements.
What should you do?
Summarize the DimDate table to the month level.
Summarize the FactSales table to the month level.
Summarize the FactSales table to the product category level.
Summarize the FactSales table to the quarter level.
Answer is Summarize the DimDate table to the month level.
Which are calculated on demand?
Calculated columns
Calculated tables
Measures
Answer is Measures
Which are calculated based on the filters that are used by the report user? Calculated columns or measures?
Measures
Calculated columns
Answer is Measures
Which DAX function evaluates an expression in a modified filter context?
SUMX
CALCULATE
ALL
Answer is CALCULATE
Why would you want to override the default context?
To create measures that behave according to the user’s selection
To create measures that behave according to your intentions, regardless of what the user selects
Answer is To create measures that behave according to your intentions, regardless of what the user selects
What type of Measure uses SUM to aggregate over one set of dimensions and a different aggregation over a different set of dimension?
Additive
Aggregate
Semi-additive
Answer is Semi-additive
What type of functions enable you to manipulate data using time periods?
Time intelligence
Comparer functions
Value functions
Answer is Time intelligence
Which two functions will help you compare dates to the previous month?
TOTALYTD and PREVIOUSMONTH
CALCULATE and TOTALTYD
CALCULATE and PREVIOUSMONTH
Answer is CALCULATE and PREVIOUSMONTH
You have an API that returns more than 100 columns. The following is a sample of column names.
- client_notified_timestamp
- client_notified_source
- client_notified_sourceid
- client_notified_value
- client_responded_timestamp
- client_responded_source
- client_responded_sourceid
- client_responded_value
You plan to include only a subset of the returned columns.
You need to remove any columns that have a suffix of sourceid.
How should you complete the Power Query M code?
To answer, select the appropriate options in the answer area.
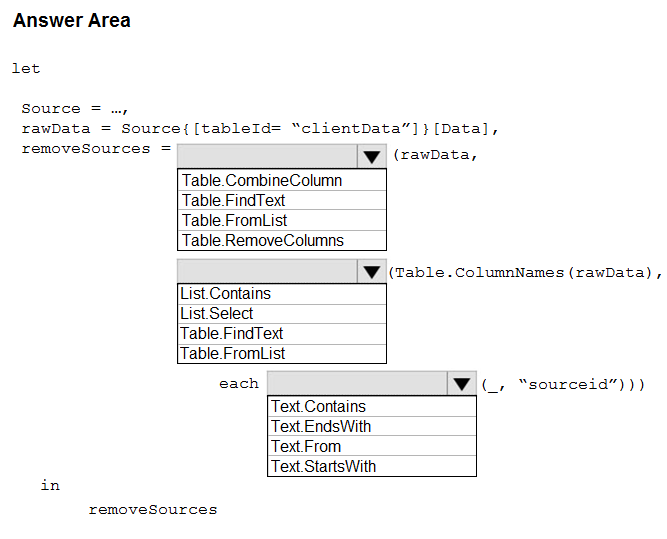
Box 1: Table.RemoveColumns
When you do Remove Columns Power Query uses the Table.RemoveColumns function
Box 2: List.Select
Get a list of columns.
Box 3: Text.EndsWith
Reference:
https://community.powerbi.com/t5/Power-Query/Remove-columns-containing-a-certain-value/td-p/759657
You import two Microsoft Excel tables named Customer and Address into Power Query. Customer contains the following columns:
- Customer ID
- Customer Name
- Phone
- Email Address
- Address ID
Address contains the following columns:
- Address ID
- Address Line 1
- Address Line 2
- City
- State/Region
- Country
- Postal Code
The Customer ID and Address ID columns represent unique rows.
You need to create a query that has one row per customer. Each row must contain City, State/Region, and Country for each customer.
What should you do?
Merge the Customer and Address tables.
Transpose the Customer and Address tables.
Group the Customer and Address tables by the Address ID column.
Append the Customer and Address tables.
Answer is Merge the Customer and Address tables.
There are two primary ways of combining queries: merging and appending.
- When you have one or more columns that you would like to add to another query, you merge the queries.
- When you have additional rows of data that you would like to add to an existing query, you append the query.
Reference:
https://docs.microsoft.com/en-us/power-bi/connect-data/desktop-shape-and-combine-data