PL-300: Microsoft Power BI Data Analyst
You have a data model that contains many complex DAX expressions. The expressions contain frequent references to the RELATED and RELATEDTABLE functions.
You need to recommend a solution to minimize the use of the RELATED and RELATEDTABLE functions.
What should you recommend?
Split the model into multiple models.
Hide unused columns in the model.
Merge tables by using Power Query.
Transpose.
Answer is Merge tables by using Power Query.
Combining data means connecting to two or more data sources, shaping them as needed, then consolidating them into a useful query.
When you have one or more columns that you'd like to add to another query, you merge the queries.
Note: The RELATEDTABLE function is a shortcut for CALCULATETABLE function with no logical expression.
CALCULATETABLE evaluates a table expression in a modified filter context and returns A table of values.
Reference:
https://docs.microsoft.com/en-us/power-bi/connect-data/desktop-shape-and-combine-data
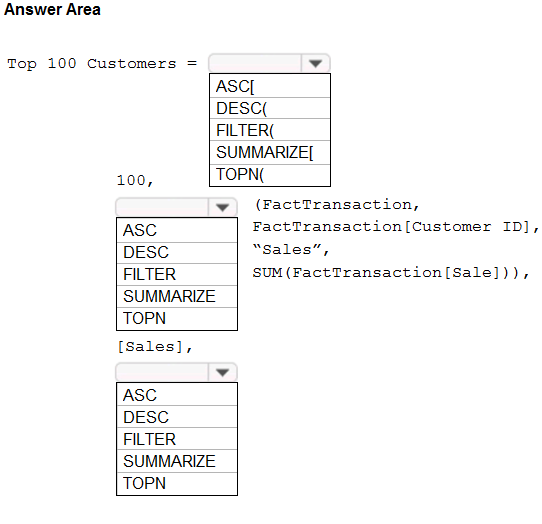
You have a Power BI report. You need to create a calculated table to return the 100 highest spending customers. How should you complete the DAX expression?

Box 1: TOPN
TOPN returns the top N rows of the specified table.
Box 2: SUMMARIZE
SUMMARIZE returns a summary table for the requested totals over a set of groups.
Box 3: DESC
Sort in descending order.
It is last in the TOPN command.
TOPN syntax:
TOPN(n_value, table, orderBy_expression, [order[, orderBy_expression, [order]]])
Reference:
https://docs.microsoft.com/en-us/dax/topn-function-dax
https://docs.microsoft.com/en-us/dax/summarize-function-dax
Your company has affiliates who help the company acquire customers.
You build a report for the affiliate managers at the company to assist them in understanding affiliate performance.
The managers request a visual showing the total sales value of the latest 50 transactions for each affiliate. You have a data model that contains the following tables.

The Affiliate table has a one-to-many relationship to the Transactions table based on the AffiliateID column.
You need to develop a measure to support the visual.
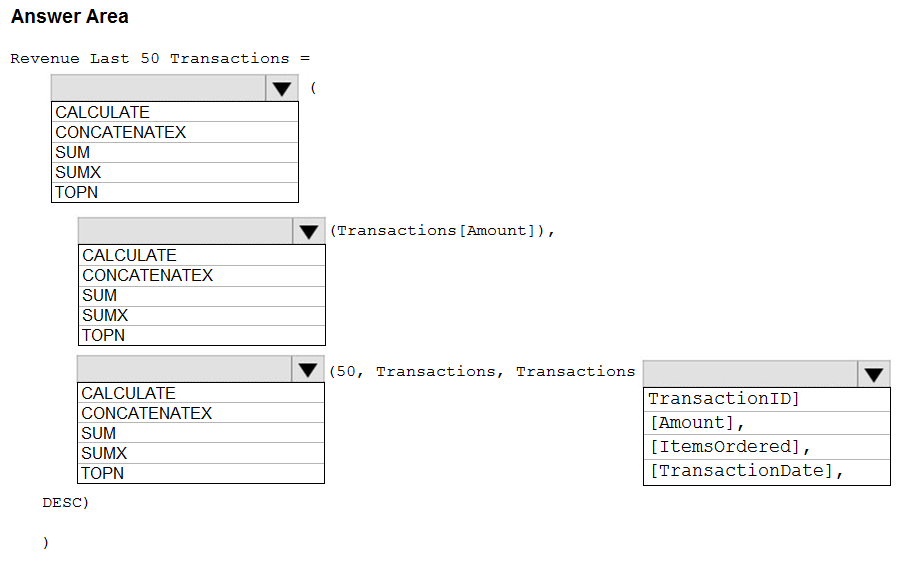
How should you complete the DAX expression?

Box 1: CALCULATE
Start with CALCULATE and use a SUMX.
CALCULATE evaluates an expression in a modified filter context.
Box 2: SUM
Box 3: TOPN
TOPN returns the top N rows of the specified table.
TOPN Syntax: TOPN(n_value, table, orderBy_expression, [order[, orderBy_expression, [order]]])
Box 4: [TransactionID]
The orderBy_expression: Any DAX expression where the result value is used to sort the table and it is evaluated for each row of table.
Reference:
https://docs.microsoft.com/en-us/dax/topn-function-dax
You start building out a dynamic calendar table in the query editor. Which of the following statements would you use to create a Start of Week column that begins on Monday?
Table.AddColumn(#"Inserted Day Name", "Start of Week", each Date.StartOfWeek([Date],Day.Sunday), type date)
Table.AddColumn(#"Inserted Day Name", "Start of Week", each Date.StartOfWeek([Date],Day.Monday), type date)
Table.AddColumn(#"Inserted Day Name", "Start of Week", each Date.EndOfWeek([Date],Day.Sunday), type date)
Table.AddColumn(#"Inserted Day Name", "Start of Week", each Date.EndOfWeek([Date],Day.Tuesday), type date)
Answer is Table.AddColumn(#"Inserted Day Name", "Start of Week", each Date.StartOfWeek([Date],Day.Monday), type date)
What does DAX stand for, in the context of Power BI?
Data Analysis Expressions
Data & Analysis Exchange
Data Aggregation Expressions
Dogs Against Xylophones
Answer is Data Analysis Expressions
Data Analysis Expressions, known as DAX, is the formula language that drives Power BI.
Where should you create calculated columns to reduce model size and improve performance?
Source data
Power Query
Data model
They all achieve the same results
Answer is Source data
Creating calculated columns as close to the source as possible helps reduce data model size and improve performance.
Which of the following is NOT true about measures?
They are evaluated based on row context
They reference entire tables or columns
They aren't visible within tables
They recalculate in response to any change to filters within the report
Answer is They are evaluated based on row context
In what field do measures typically "live" in a visual?
Rows
Columns
Values
Filters
Answer is Values
Measures are numerical, calculated values that can be analyzed in the “values” field of a report visual.
Which of these DAX function categories loops through the same calculation on each row of a table, then aggregates the results?
Logical Functions
Filter Functions
Stats Functions
Iterator Functions
Answer is Iterator Functions
Iterator (or “X”) functions allow you to loop through the same calculation on each row of a table, and then apply some sort of aggregation to the results (SUM, MAX, etc.).
Which of the following functions modifies and overrules any competing filter context?
CALCULATE
SUMX
RELATED
REPLACE
Answer is CALCULATE
CALCULATE modifies and overrules any competing filter context!